


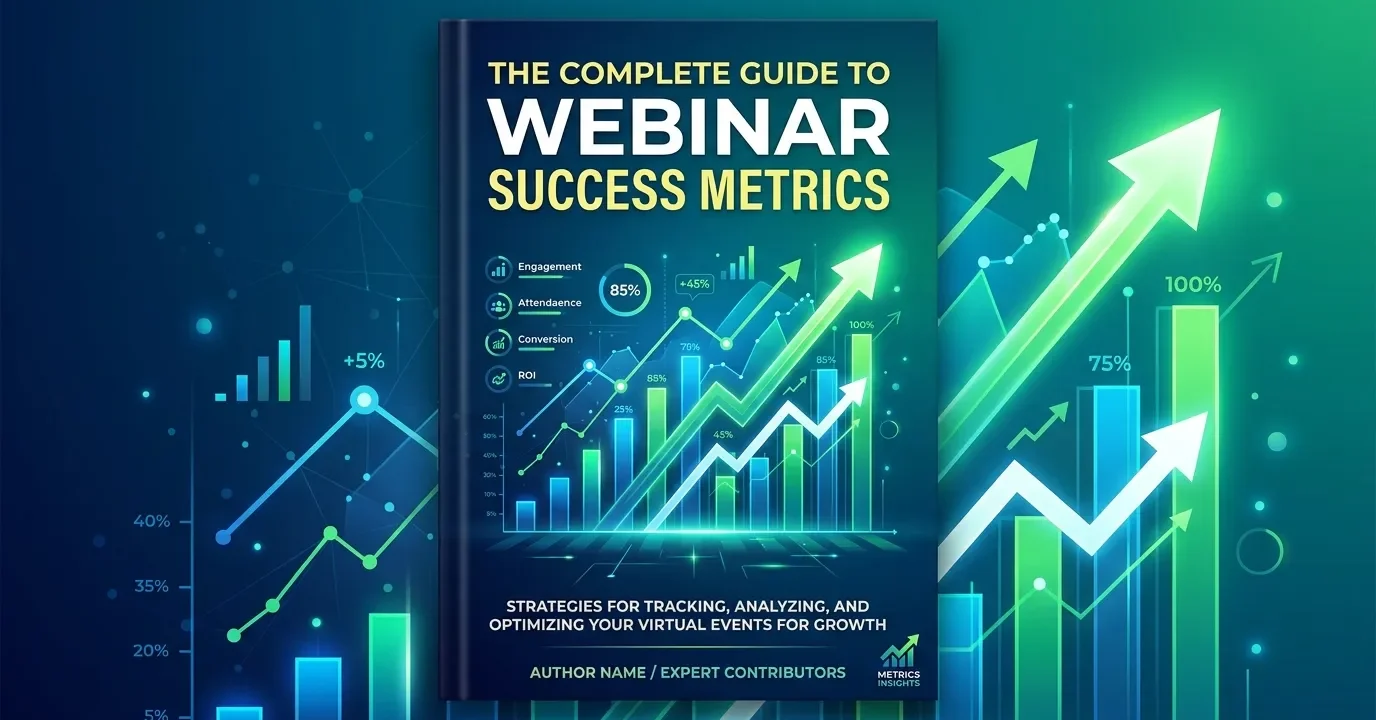
Webinar Success Metrics help you evaluate registration, attendance, engagement, lead generation, conversions, and ROI. By tracking the right KPIs before, during, and after each webinar, you can identify what works, improve future events, and maximize business results.
Webinar success metrics are the quantitative and qualitative indicators used to measure the performance, engagement, and ROI of a webinar. Key metrics include registration rate, attendance rate, engagement score, conversion rate, and lead generation data—each telling a different part of the story about how well your webinar performed.
Hosting a webinar takes real effort. You plan the content, recruit speakers, promote the event, and manage the logistics—all before a single attendee logs on. So when it’s over, it’s only fair to ask: was it worth it?
The answer lives in your data.
Webinar success metrics are what separate a gut feeling (“I think it went well”) from an informed verdict (“We generated 47 qualified leads and achieved a 62% attendance rate”). Without the right metrics in place, you’re essentially flying blind—repeating what doesn’t work and missing opportunities to double down on what does.
This guide covers everything you need to measure webinar performance effectively. From registration rates and attendance benchmarks to ROI calculations and lead generation tracking, you’ll walk away knowing exactly which numbers matter, what they mean, and how to act on them.
What Are Webinar Performance Metrics and Why Do They Matter?

Webinar performance metrics are the data points that reveal how your webinar performed across every stage of the funnel—from initial promotion to post-event follow-up. They give marketers, event planners, and sales teams a clear picture of what resonated with their audience and what fell flat.
Measuring performance matters for a few reasons. First, it creates accountability. When you set targets before an event and measure against them afterward, you build a culture of continuous improvement. Second, it justifies budget. Stakeholders want to see evidence that webinars drive business value—and the right metrics make that case clearly. Third, it informs future strategy. Each webinar becomes a learning opportunity, helping you refine your topics, formats, promotion channels, and follow-up sequences over time.
Most webinar platforms—such as Zoom Webinars, GoTo Webinar, Demio, and ON24—offer built-in analytics dashboards. But understanding which metrics to prioritize and how to interpret them is a skill in itself. That’s what this guide is here to help with.
Webinar KPIs: Choosing the Right Ones for Your Goals
Not every metric deserves equal weight. The webinar KPIs (key performance indicators) you focus on should reflect the specific goal of each event.
A demand generation webinar, for example, should prioritize lead volume and conversion rate. A customer education webinar might focus more on completion rate and satisfaction scores. A thought leadership webinar could emphasize audience reach and engagement depth.
Common webinar goals and their primary KPIs:
- Lead generation webinars: Number of leads captured, lead quality score, conversion rate
- Sales enablement webinars: Pipeline influenced, opportunities created, sales cycle length
- Customer education/onboarding webinars: Completion rate, satisfaction score, support ticket reduction
- Brand awareness webinars: Registrations, attendee reach, social shares, replay views
Before your next event, define one to three primary KPIs that align with your goal. This keeps reporting focused and makes it easier to communicate results to your team.
Webinar Engagement Metrics: Are People Actually Paying Attention?

Attendance tells you who showed up. Engagement tells you who cared.
Webinar engagement metrics measure the quality of the attendee experience during the event. High engagement typically correlates with stronger conversion rates, better retention, and more positive brand perception.
What counts as webinar attendee engagement?
Most webinar platforms track engagement through several signals:
- Poll participation rate: The percentage of attendees who responded to in-webinar polls
- Q&A activity: The number of questions submitted and upvoted
- Chat messages: The volume of chat interactions throughout the session
- Reactions and emoji responses: Real-time sentiment indicators (available on platforms like Zoom and Hopin)
- Handouts downloaded: Whether attendees accessed supplementary resources
- Average attention score: Some platforms, like ON24, calculate an engagement score based on a weighted average of interaction signals
A strong engagement benchmark to aim for is a poll participation rate above 30% and a Q&A submission rate above 15% of attendees. These aren’t universal standards, but they provide a useful baseline for comparison across your own events.
Low engagement mid-webinar is often a sign that content is too dense, the speaker’s pacing is off, or interactive elements are spaced too far apart. Reviewing engagement drop-off points in your platform’s analytics can pinpoint exactly where you lost the room.
Webinar Attendance Rate: What Does a Good Turnout Look Like?
How is webinar attendance rate calculated?
Webinar attendance rate is calculated by dividing the number of attendees who joined the live event by the total number of registrants, then multiplying by 100.
Formula: (Live Attendees ÷ Total Registrants) × 100 = Attendance Rate %
Industry data from ON24 suggests that the average webinar attendance rate sits between 35% and 45% of registrants. Anything above 50% is considered strong performance. If your attendance rate is consistently below 30%, it may signal issues with reminder emails, scheduling, or audience-topic fit.
Several factors influence attendance rate, including:
- Time of day and day of week (mid-week, mid-morning sessions tend to perform best)
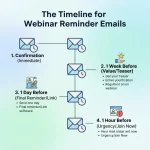
- Reminder email cadence (sending reminders 1 week, 1 day, and 1 hour before the event can significantly improve show rates)
- Relevance of the topic to the registered audience
- Competing events or industry news on the same day
Tracking attendance rate over time—across multiple webinars—reveals patterns that can inform your scheduling and promotion strategy.
Your promotional approach also plays an important role in registration and attendance. Using proven webinar promotion strategies can help you attract a more relevant audience and increase the likelihood that registrants actually attend.
Webinar Registration Rate: Measuring Top-of-Funnel Performance
What does webinar registration rate tell you?
Registration rate measures how effectively your webinar promotion converts interested prospects into confirmed registrants. It’s calculated by dividing registrations by the total number of people who viewed your registration page.
Formula: (Registrations ÷ Registration Page Visitors) × 100 = Registration Rate %
A healthy webinar registration rate typically falls between 30% and 40% for targeted email campaigns, and lower for paid or cold traffic sources. If your registration rate is underperforming, the issue usually lies in one of three places: the value proposition on the registration page isn’t clear enough, the topic doesn’t resonate with the audience you’re reaching, or there’s too much friction in the sign-up process (too many form fields, for instance).
Registration volume also matters independently of rate. A high registration rate from a small audience may still result in too few attendees to generate meaningful pipeline. Balancing reach with conversion efficiency is the key.
Your registration page should make the webinar’s value immediately clear and minimize unnecessary friction. Applying proven webinar landing page best practices can help improve registration performance before the event even begins.
Webinar Conversion Rate: Turning Attendees Into Customers
Conversion rate is arguably the most commercially important metric in your webinar analytics toolkit. It answers the question: how many attendees took the desired action after the webinar?
How is webinar conversion rate calculated?
Formula: (Conversions ÷ Total Attendees) × 100 = Conversion Rate %
What counts as a “conversion” depends on your goal. Common conversion actions include:
- Booking a demo or sales call
- Signing up for a free trial
- Downloading a content asset
- Making a direct purchase
- Completing a post-webinar survey
For B2B webinars, a conversion rate of 20% or higher (based on demo requests or trial sign-ups) is a strong result. For direct product sales, benchmarks vary significantly by price point and industry.
To improve conversion rate, focus on your call-to-action (CTA) placement and clarity. CTAs delivered during peak engagement moments—such as right after a compelling case study or a live product demo—tend to perform better than a single CTA dropped at the end.
Webinar ROI Metrics: Proving the Business Case

Return on investment (ROI) is the metric that executive stakeholders care about most. Calculating webinar ROI requires you to compare the total cost of producing and promoting the event against the revenue or pipeline it generated.
Basic formula: ((Revenue Generated − Total Cost) ÷ Total Cost) × 100 = ROI %
Total costs to factor in may include platform fees, speaker fees, paid promotion spend, design and content production, and staff time. Revenue attribution can come from direct sales, influenced pipeline, or estimated lifetime value of leads converted.
For webinars that don’t generate direct revenue, you can assign a monetary value to each qualified lead using your average lead-to-customer conversion rate and average deal size. This approach—sometimes called pipeline ROI—is common in B2B marketing.
Tracking ROI across a webinar series also helps you identify which formats (panel discussions, solo presentations, product demos) and which topics drive the highest returns.
Webinar Lead Generation Metrics: Quantity, Quality, and Velocity
Webinars are one of the highest-intent lead generation channels available to B2B marketers. Someone who registers for—and attends—a 45-minute webinar on your specific topic has demonstrated a meaningful level of interest. That signal is valuable.
Key webinar lead generation metrics include:
- Total leads captured: The raw number of new contacts added to your database
- Marketing qualified leads (MQLs): Leads that meet your scoring criteria based on job title, company size, engagement, etc.
- Lead-to-opportunity rate: The percentage of webinar leads that progress to a sales opportunity
- Cost per lead (CPL): Total webinar cost divided by number of leads generated
- Sales cycle impact: Whether webinar-sourced leads close faster than leads from other channels
Post-webinar follow-up speed also affects lead quality conversion. Research from Lead Response Management shows that contacting a lead within five minutes of an inquiry makes conversion significantly more likely than waiting even 30 minutes. Applying this principle to webinar follow-up—sending personalized outreach within hours of the event—can meaningfully improve your lead-to-opportunity rate.
Webinar Analytics and Reporting: Turning Data Into Action
Collecting metrics is only half the job. The other half is building a reporting process that makes the data actionable.
What should a webinar analytics report include?
A complete post-event report should cover:
- Pre-event: Registrations, registration rate, traffic sources, email open and click rates
- During the event: Peak live attendance, average watch time, engagement score, poll responses, Q&A volume
- Post-event: Replay views, conversion rate, leads generated, CTA clicks, survey responses
- Business impact: Pipeline created, deals influenced, ROI estimate
Most platforms export this data automatically, but you’ll want to consolidate it into a single report template that your team reviews after every webinar. Over time, this creates a performance baseline—and that baseline is what lets you spot meaningful improvements.
Segmenting your data adds another layer of insight. Breaking down attendance and engagement by audience segment (e.g., industry, company size, or lead stage) helps you understand which audiences find your webinar content most valuable. That knowledge feeds directly back into your targeting and topic selection for future events.
Start Measuring What Actually Matters
Webinar success looks different for every organization. For one team, it’s 200 registrants and a packed Q&A. For another, it’s five enterprise demos booked before the session ends. The metrics themselves don’t define success—your goals do.
What matters is building a consistent measurement framework before your next event: define your KPIs, set realistic benchmarks, track the right data points during and after the webinar, and use those insights to make your next event sharper.
The teams that treat every webinar as a data opportunity—not just a content delivery exercise—are the ones that see compounding improvements over time. Start there, and the results will follow.
Frequently Asked Questions
What is a good attendance rate for a webinar?
A good webinar attendance rate is typically between 35% and 45% of total registrants. Rates above 50% are considered strong. Factors like reminder email frequency, scheduling, and topic relevance all affect attendance rate significantly.
How do you measure webinar engagement?
Webinar engagement is measured through interaction signals such as poll participation rate, Q&A submissions, chat activity, reactions, and resource downloads. Some platforms like ON24 aggregate these into a single engagement score for easier benchmarking.
What is webinar ROI and how is it calculated?
Webinar ROI measures the financial return on your webinar investment. It’s calculated using the formula: ((Revenue Generated − Total Cost) ÷ Total Cost) × 100. For webinars that don’t generate direct revenue, pipeline ROI—based on estimated deal value of leads generated—is a useful alternative.
What’s the difference between webinar KPIs and webinar metrics?
Webinar metrics are all measurable data points from your event (e.g., registrations, chat messages, replay views). KPIs are the specific metrics you’ve chosen to prioritize based on your webinar’s goal. All KPIs are metrics, but not all metrics are KPIs.
How many leads should a webinar generate?
Lead volume varies widely based on audience size, topic, and promotion budget. A well-promoted B2B webinar with 100–200 attendees might generate 20–50 qualified leads. What matters more than raw volume is lead quality—measured by how many progress to a sales opportunity.
Which webinar metrics should I report to stakeholders?
Focus on metrics tied to business outcomes: leads generated, conversion rate, pipeline influenced, cost per lead, and estimated ROI. Supplement these with engagement highlights (e.g., poll participation, Q&A activity) to demonstrate audience quality and content relevance.
What are Webinar Success Metrics?
Webinar Success Metrics are measurable indicators used to evaluate a webinar’s performance, including registrations, attendance, engagement, conversions, leads, and ROI.
What is a good webinar attendance rate?
A webinar attendance rate of 35%–45% of total registrants is generally a useful benchmark, while rates above 50% can indicate strong performance.
How do you measure webinar engagement?
Measure engagement through poll participation, Q&A submissions, chat activity, reactions, resource downloads, average watch time, and overall engagement scores.
What is a good webinar conversion rate?
A strong conversion rate depends on the webinar’s goal and industry. For B2B webinars, 20% or higher for actions such as demo requests or trial sign-ups can be a strong result.
How is webinar ROI calculated?
Webinar ROI can be calculated using: ((Revenue Generated − Total Cost) ÷ Total Cost) × 100. For lead-focused webinars, estimated pipeline value can also be used.
Which webinar KPIs should marketers track?
Important KPIs include registration rate, attendance rate, engagement, leads generated, conversion rate, cost per lead, pipeline influenced, and ROI.
How many leads should a webinar generate?
Lead volume varies based on audience size, topic, promotion, and industry. Lead quality is often more important than total volume, so track how many leads become qualified opportunities.
How can I improve my webinar attendance rate?
Use multiple reminder emails, choose a convenient time, create a relevant topic, simplify registration, and clearly communicate the value attendees will receive.
Why is webinar engagement important?
High engagement indicates that attendees are actively interested in your content. Strong interaction can also increase satisfaction, conversions, and the likelihood of attendees becoming qualified leads.
How can Webinar Success Metrics improve future events?
Analyzing Webinar Success Metrics helps you identify which topics, promotional channels, speakers, CTAs, and formats perform best, allowing you to make data-driven improvements for future webinars.














4 replies on “The Complete Guide to Webinar Success Metrics”
[…] your attendance performance alongside broader webinar success metrics helps you understand whether your promotional and reminder strategies are actually […]
[…] webinar success metrics more broadly helps establish realistic benchmarks before evaluating whether a specific automated […]
[…] the complete guide to webinar success metrics is a useful starting point here, since attribution only works well when you’re already […]
[…] your webinar success metrics as a full set — rather than fixating on registration numbers alone — gives a far more complete […]