


In today’s digital landscape, webinars have evolved into essential tools for generating leads, nurturing prospects, and driving revenue. However, simply hosting a presentation isn’t enough—understanding your performance through webinar analytics is crucial for ongoing success. By gathering and interpreting data across each stage of your webinar funnel, you can make informed decisions, boost engagement, and maximize your marketing ROI. In this comprehensive guide, you’ll discover how to leverage webinar analytics to refine your strategy, pinpoint areas for improvement, and ultimately turn every event into a high-impact growth engine. Ready to unlock the full potential of your live and on-demand sessions? Let’s dive into the metrics, tools, and best practices that will elevate your approach this year.
Why Webinar Analytics Matter
Every webinar generates a wealth of information about how your audience behaves—from the moment they register to the instant they click away. Without measuring these interactions, you’re left guessing which elements resonate and where attendees lose interest. Webinar analytics provide clarity by revealing patterns in registration sources, attendance rates, and engagement signals, empowering you to prioritize what works and eliminate what doesn’t.
For instance, tracking registration conversion rates helps you determine whether your landing page copy, design, and offer are compelling enough. Monitoring attendance rates shows if your reminders and timing align with your audience’s schedule. Engagement metrics—such as poll response rates and chat activity—highlight the moments when participants are most invested. Finally, conversion metrics tie webinar participation back to real business outcomes, showing you which calls-to-action truly drive sales.
By embracing data-driven insights, you can enhance every phase of your webinar funnel. Maybe your email sequence needs tighter personalization, or perhaps your slide deck requires more interactive elements. Modern organizations—from universities to government agencies—rely on analytics to guide their outreach efforts (Pew Research Center). With webinar analytics in your toolkit, you’ll be equipped to refine strategies, increase audience satisfaction, and boost ROI for each event.
Registration and Attendance Metrics to Track
![]()
Before evaluating engagement or revenue, you must first understand whether people were motivated enough to register and committed enough to attend. Registration and attendance metrics provide the earliest signals of webinar campaign effectiveness. These numbers reveal how attractive your topic is, how persuasive your messaging performs, and whether your scheduling aligns with audience availability.
Registration Metrics
Registration metrics begin with Total Registrations, the simplest indicator of top-of-funnel interest. A high registration count often suggests strong topic-market fit, effective promotion, or strong brand recognition. However, raw totals should never be viewed alone. Five hundred registrations from a highly targeted niche audience may outperform five thousand broad, low-intent signups.
The Registration Conversion Rate is more meaningful. This metric is calculated by dividing registrations by landing page visitors. If 1,000 people visit your registration page and 250 sign up, your conversion rate is 25%. Strong conversion rates indicate your landing page headline, speaker credibility, value proposition, and form design are working effectively.
Low conversion rates often point to specific friction points:
- Too many form fields
- Weak or unclear webinar benefits
- Poor mobile experience
- Slow page loading speed
- Lack of urgency
- Confusing CTA buttons
Another essential metric is Traffic Source Performance. Knowing whether registrations came from email, LinkedIn ads, search traffic, affiliates, or partnerships allows you to compare channel quality. One source may produce high volume but poor attendance, while another brings fewer but highly engaged registrants.
Cost per Registration (CPR) helps determine efficiency. If you spent $1,000 on ads and acquired 200 registrants, CPR is $5. This metric is especially useful when comparing campaigns or deciding whether to scale paid acquisition.
Registration Velocity is often overlooked but powerful. This tracks how quickly people register over time. If most signups occur in the final 48 hours, your reminder strategy may be more important than early promotion. If registrations spike immediately after launch, your topic likely has strong demand.
Attendance Metrics
Registrations alone do not equal impact. Attendance metrics reveal whether people actually showed up.
The most common benchmark is Attendance Rate, calculated by dividing live attendees by total registrants. If 300 out of 600 registrants attend, attendance is 50%. This figure reflects reminder quality, perceived importance, event timing, and friction in joining.
Low attendance may stem from:
- Weak reminder emails
- Complicated join process
- Scheduling conflicts
- Time zone confusion
- Registrants with low initial intent
No-Show Rate is equally valuable because no-shows are still leads. These individuals may engage with replay content if nurtured properly.
Join Time Distribution tracks whether attendees arrived early, on time, or late. If many people join 10 minutes late, consider delaying key content slightly or adjusting reminders.
Peak Concurrent Attendance shows the highest number of simultaneous viewers. This helps compare event popularity over time.
Attendance by Source is especially powerful. If email-generated registrants attend at 65% while ad-generated registrants attend at 30%, your audience quality differs dramatically.
By closely monitoring registration and attendance metrics, teams can improve topic selection, streamline landing pages, optimize reminder flows, and schedule webinars at times audiences actually prefer.
Engagement and Interaction Metrics
While registrations and attendance offer a high-level view, engagement metrics dive deeper into how attendees interact with your content. These insights indicate the value you’re delivering and highlight opportunities to foster stronger connections.
Average Watch Time
Measures total minutes viewed divided by the number of attendees. Aim for attendees to watch at least 60–70% of your session. Lower averages may signal that your content is too long, lacks pacing, or fails to hold attention.
Poll and Survey Participation
Interactive elements such as polls, quizzes, and surveys are powerful engagement drivers. A response rate exceeding 50% suggests that attendees are actively participating. Low rates may point to ambiguous questions or a lack of clear incentives.
Chat and Q&A Activity
Tracking the volume and quality of chat messages and questions asked during the webinar helps you gauge audience interest. Encourage interaction by dedicating time for live Q&A and prompting participants to share feedback.
Peak Attendance Points
Identifying the timestamps when viewer numbers spike or dip can reveal which segments of your content resonate most. Use this insight to replicate high-engagement moments in future presentations.
Conversion and Revenue Metrics
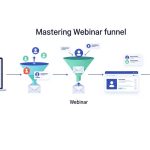
![]() Webinar analytics ultimately connect audience engagement back to tangible business outcomes. Conversion metrics quantify how effectively your webinar drives sales and fosters long-term customer relationships.
Webinar analytics ultimately connect audience engagement back to tangible business outcomes. Conversion metrics quantify how effectively your webinar drives sales and fosters long-term customer relationships.

Collecting data is only half the battle; the right tools and tactics will enable you to transform metrics into meaningful improvements. Below are essential platforms and innovative approaches to elevate your webinar platforms game.
Analytics and Tracking Platforms
- Webinar Software: Leading solutions like Zoom, GoToWebinar, and Demio provide built-in dashboards for registration, attendance, and engagement metrics.
- Marketing Automation: Tools such as HubSpot or Marketo can monitor email performance, track UTM parameters, and attribute post-webinar conversions (U.S. Census Bureau insights emphasize the importance of data integration).
- CRM Integrations: Sync registrant data with Salesforce or Zoho CRM to visualize the impact of webinars on pipeline velocity and revenue.
Advanced Techniques
- A/B Testing: Experiment with email subject lines, registration page layouts, and CTA formats to determine the most effective variations.
- Predictive Modeling: Leverage machine learning to identify registrants most likely to convert, then tailor follow-up messaging toward those high-value prospects.
- Heatmap Analysis: Use tools like Hotjar during on-demand replays to see where viewers pause or rewind, refining your recordings based on real user behavior.
- Real-Time Dashboards: Create live visualizations of your webinar funnel to monitor registrations, attendance, and engagement as the event unfolds.
Conclusion
Webinar analytics are indispensable for organizations seeking to maximize the impact of their virtual events in today’s competitive market. By tracking registration, attendance, engagement, and conversion metrics—and leveraging the right platforms and advanced strategies—you’ll gain actionable insights that drive continual improvement. Whether you’re refining promotional campaigns, optimizing content delivery, or personalizing follow-up efforts, webinar analytics empower you to make data-driven decisions that enhance audience satisfaction and deliver measurable ROI. Start applying these techniques in your next event and watch your webinar program evolve into a powerful engine for growth.
FAQ
1. What is webinar analytics?
Webinar analytics refers to the data collected from registrations, attendance, engagement, and conversions during virtual events. These insights help businesses understand audience behavior, improve webinar strategy, and measure return on investment. Tracking analytics allows marketers to make smarter decisions for future webinars and campaigns.
2. Why are webinar analytics important?
Webinar analytics are important because they reveal what works and what needs improvement. Metrics like attendance rates, watch time, and conversions help optimize promotions, content delivery, and follow-up campaigns. Businesses using analytics can improve engagement, generate stronger leads, and increase webinar marketing results consistently.
3. Which registration metrics should I track?
Key registration metrics include total sign-ups, registration conversion rate, traffic source performance, cost per registration, and registration velocity. These numbers show how effective your landing page and promotional channels are. Monitoring them helps improve targeting, messaging, and campaign efficiency for future webinar events.
4. What is a good webinar attendance rate?
A strong webinar attendance rate usually falls between 45% and 55% of total registrants. Rates below 40% may indicate weak reminder emails, poor timing, or registration friction. Improving reminders, simplifying access, and choosing better schedules can significantly increase live attendance performance over time.
5. How do I measure webinar engagement?
Measure engagement through average watch time, poll participation, survey responses, chat activity, Q&A volume, and audience retention. These metrics show whether attendees found your webinar valuable. Strong engagement often means your topic, presentation style, and interactive elements successfully kept viewers interested throughout the session.
6. What is average watch time?
Average watch time measures how long attendees stay connected during your webinar. It is calculated by dividing total minutes watched by the number of viewers. Higher watch time indicates stronger content relevance, better pacing, and more engaging delivery that keeps attendees interested longer overall.
7. How can webinar analytics improve conversions?
Analytics reveal which calls-to-action, offers, and webinar moments generate the most clicks or purchases. By studying attendee behavior, businesses can optimize sales pitches, improve follow-up timing, and personalize offers. These adjustments increase conversions and turn more webinar participants into paying customers successfully.
8. Can webinar analytics integrate with CRM systems?
Yes, most webinar platforms integrate with CRM systems like Salesforce, HubSpot, and Zoho. This allows businesses to track attendee behavior, segment leads, and automate follow-up campaigns. CRM integration helps sales teams prioritize qualified prospects based on webinar engagement and buying intent signals.
9. What tools help track webinar analytics?
Popular webinar analytics tools include Zoom, GoToWebinar, Demio, WebinarJam, HubSpot, Google Analytics, and Hotjar. These platforms track registrations, attendance, engagement, source attribution, and conversions. Using the right tools helps marketers gather accurate insights and improve webinar performance through data-driven optimization strategies.
10. How often should I review webinar analytics?
Review webinar analytics before, during, and after every event. Pre-event analysis improves promotions, live monitoring helps real-time adjustments, and post-event reporting identifies lessons for future webinars. Regular reviews create a continuous improvement process that strengthens results and increases long-term return on investment.

Josh Lemon, Content Strategy Consultant, has extensive experience in creating compelling webinar content that resonates with audiences. Skilled in storytelling, SEO, and audience insights, Riley helps brands deliver webinars that educate, engage, and convert effectively.


No Comments